Our software is pretty cool and we aren’t just saying it. Yes, we may be bias but what does make Clobba great? Take a look at these features and judge for yourself.
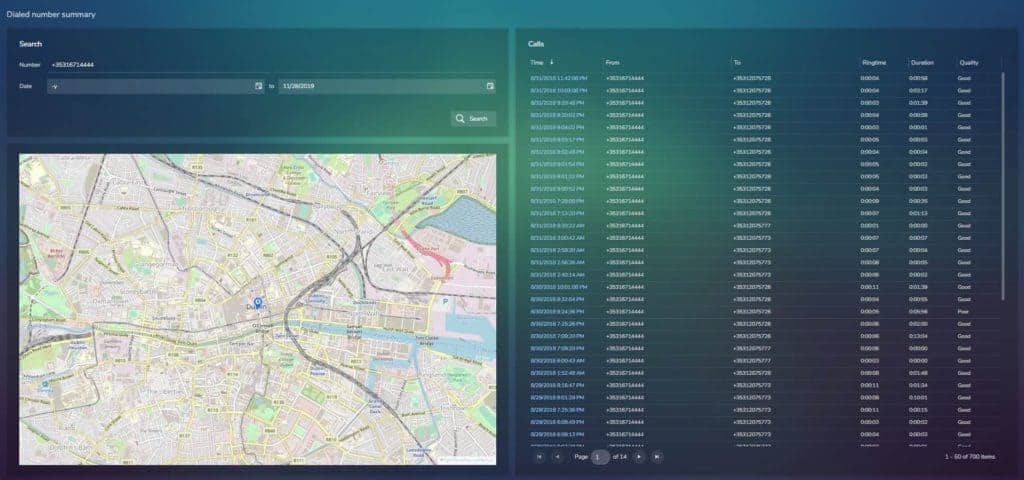
Number List
This understated yet powerful feature is useful in so many ways. From managing your key client interactions to finding out who called emergency services to country by country activity, data is presented quickly and clearly for the specified time period. With a location map to help orient your data set, this feature really delivers.
Quality Index
The Quality Index puts the power of decision into the hands of the IT team. Managing call quality is paramount to a successful UC environment, and the Quality Index allows businesses to set their own quality category thresholds for up to 16 parameters including jitter, latency, packet loss and MOS.
Clobba MT – App Usage in Teams
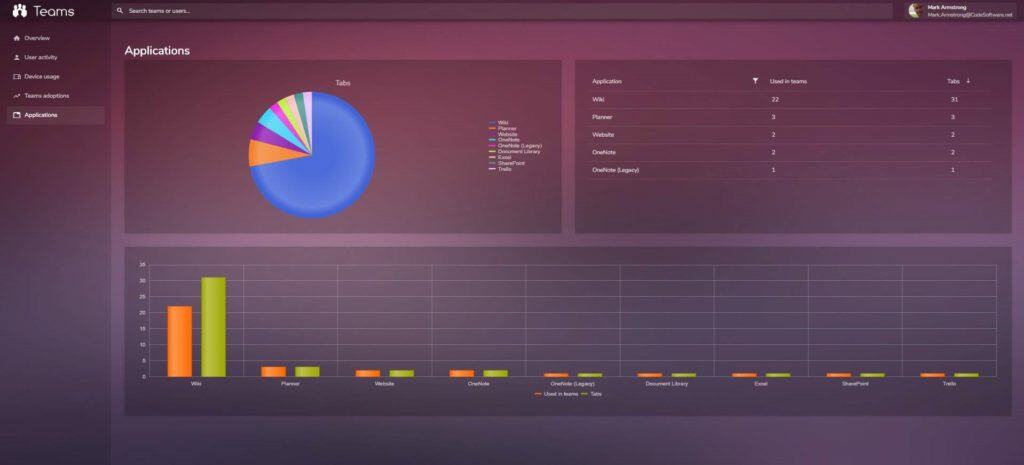
ClobbaMT gives Microsoft Teams user adoption and collaboration reporting including App usage. App usage can be a new area of working for many employees making it important to have visibility of usage ensuring it is at the expected level and highlighting any requirements for further education or training.
Clobba DM – Dashboard
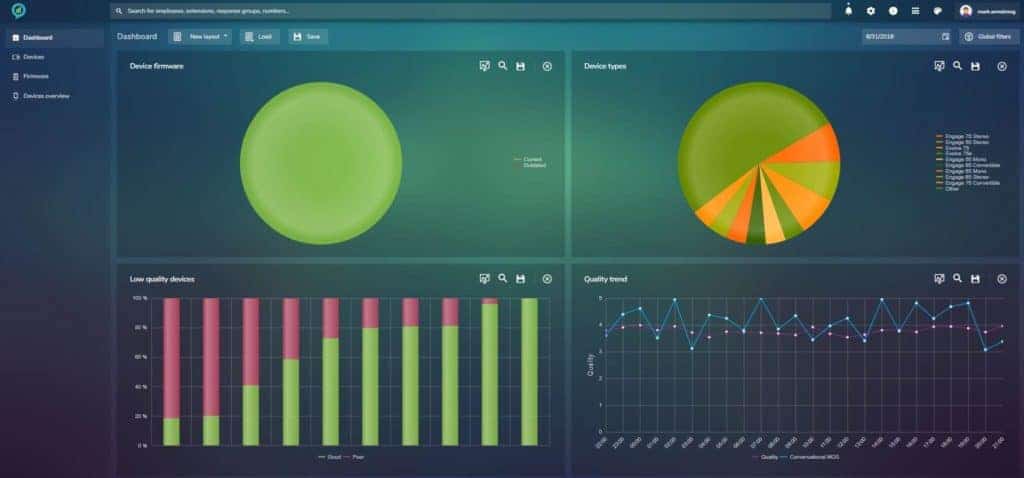
The Device Manager dashboards delivers user defined data in graphical format, showing device make & model, device firmware levels, call quality, and low/high performing devices to illustrate clearly the use of all devices within the organisation. These insights reduce time spent managing your headset estate and ensure adoption of devices it is at an acceptable level.
DID Allocations with Clobba RM
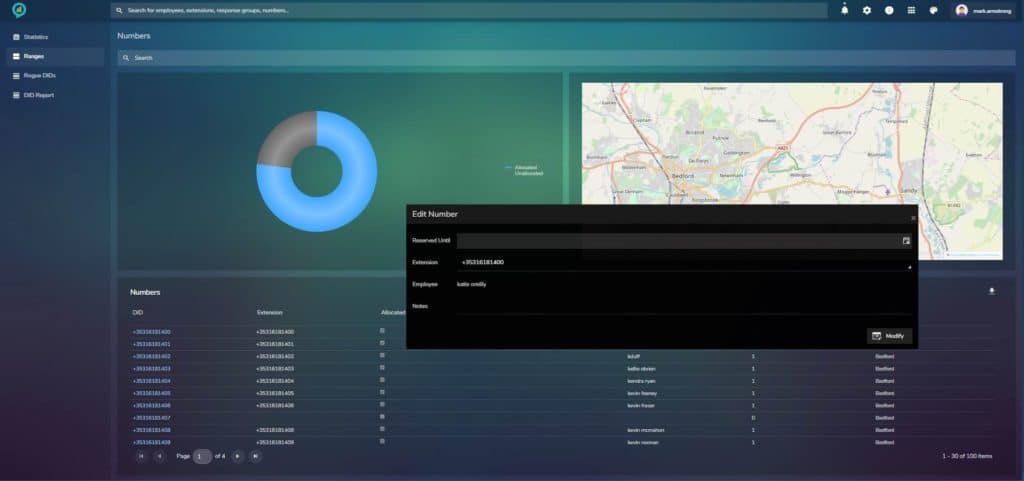
Clobba RM delivers monitoring and management of multiple DID ranges within and organisation. The DID allocation feature allows for allocation of a selected DID to an employee including the ability to reserve the number for new allocation or holding the number for a defined time after the DID is unallocated. This reduces the risk element of managing large volumes of DID’s with spreadsheets or other more manual processes.
Call Quality Map
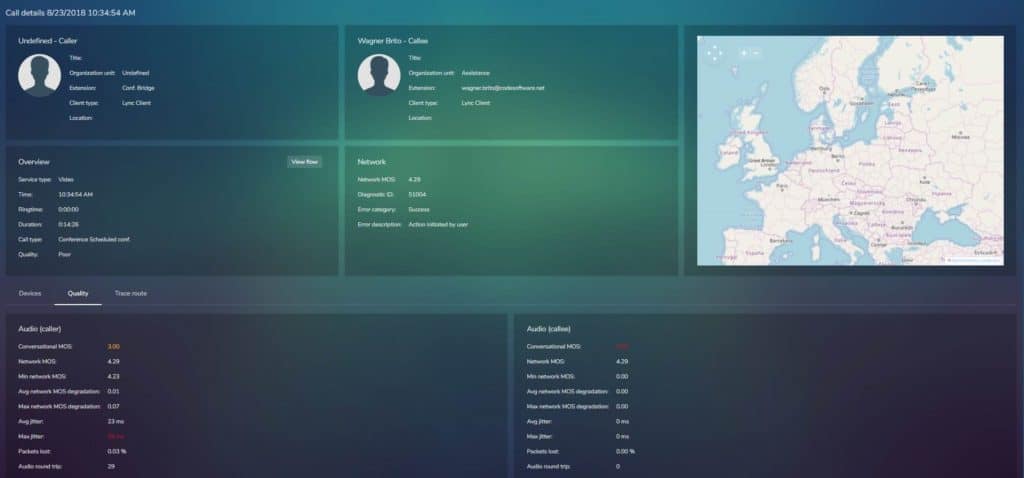
The Call Quality Monitor delivers visibility of any call quality issues that may arise on a system. It is the first step towards diagnosing quality issues as it displays network and conversational MOS, jitter, latency & packet loss, as well as the device used, and the connectivity method and IP address. By analysing this data, the IT technicians can understand whether issues are local to one or a few users, or whether there is a broader problem to manage.
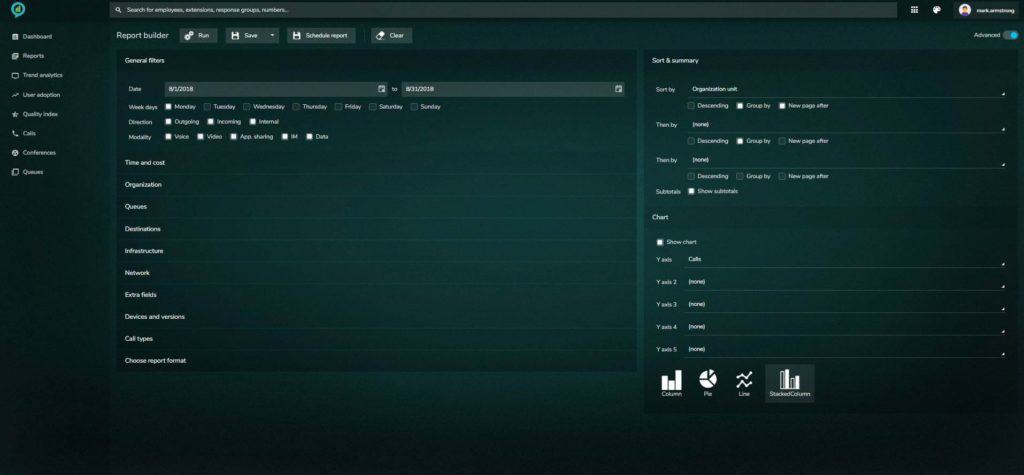
Report Designer
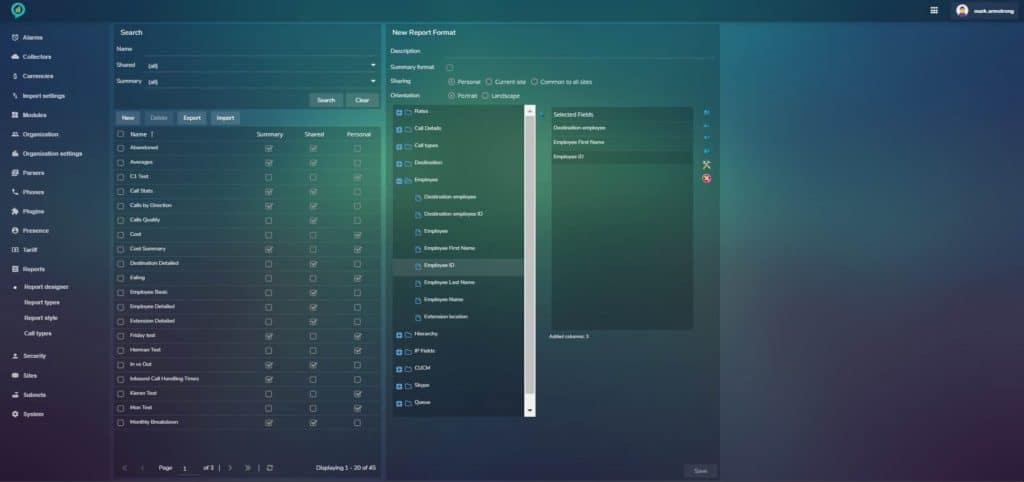
The report designer allows for tailored report building within Clobba. Selection of the fields to be displayed on reports is achieved by dragging and dropping resulting in reports only showing the required data. The report designer puts the power of relevant information into the hands of Clobba users, you can’t manage what you can’t measure.
Colour Palette
The colour palette feature is a great creative tool for each individual. Each user can change the background colours depending on taste, style or mood!
User Activity in Teams
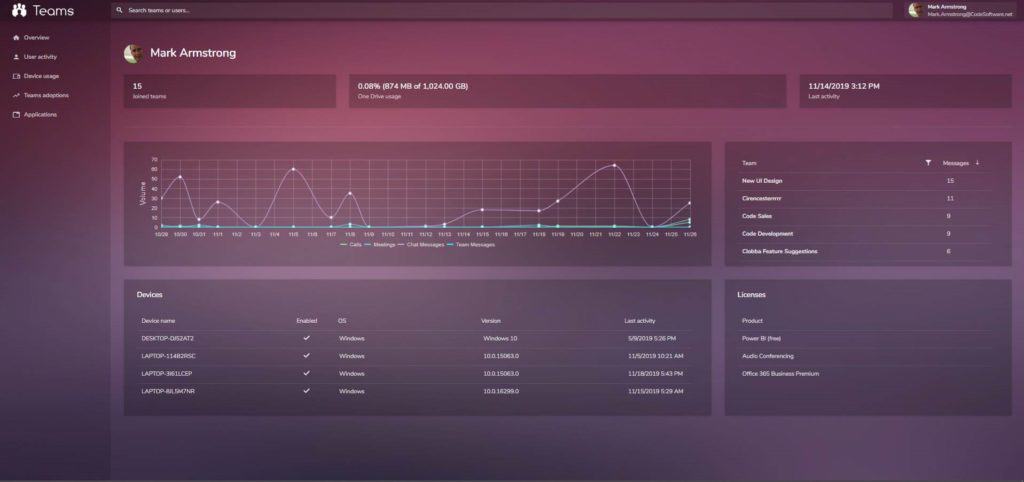
ClobbaMT is used to report on #microsoftteams adoption. The User Activity shows for selected employee the general activity per day including volumes of calls, meetings, chat messages, teams messages, devices used, Teams they are in, last activity time and date, one drive usage and licences they have. All of this information can be used to highlight any areas of low adoption leading to further education or training.
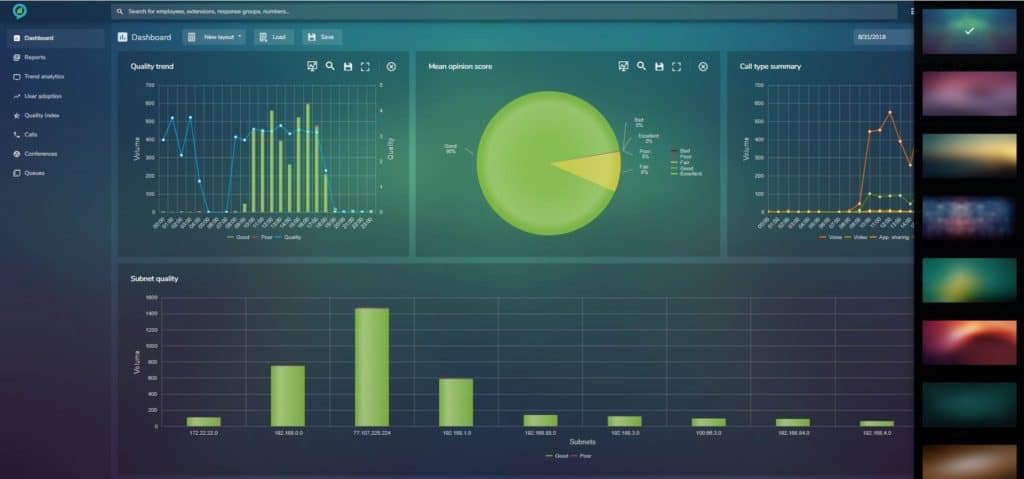
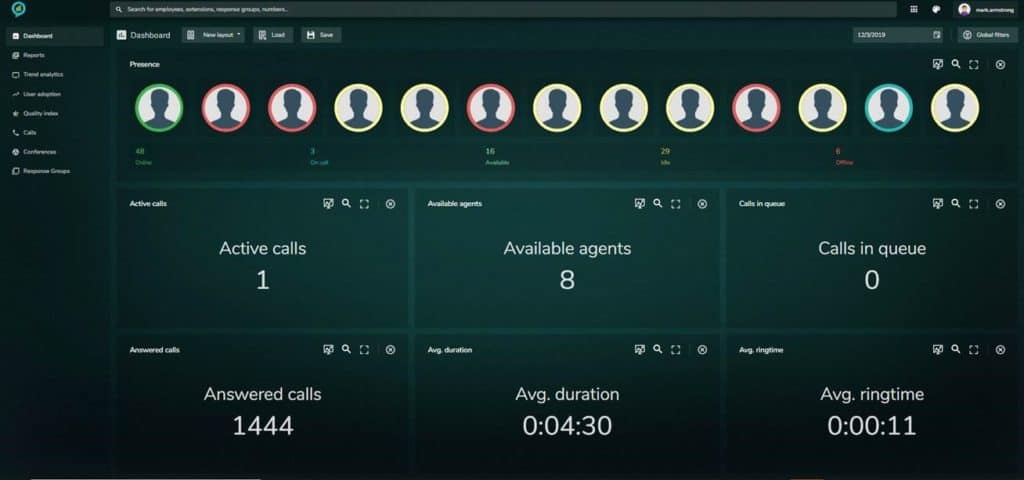
Dashboards
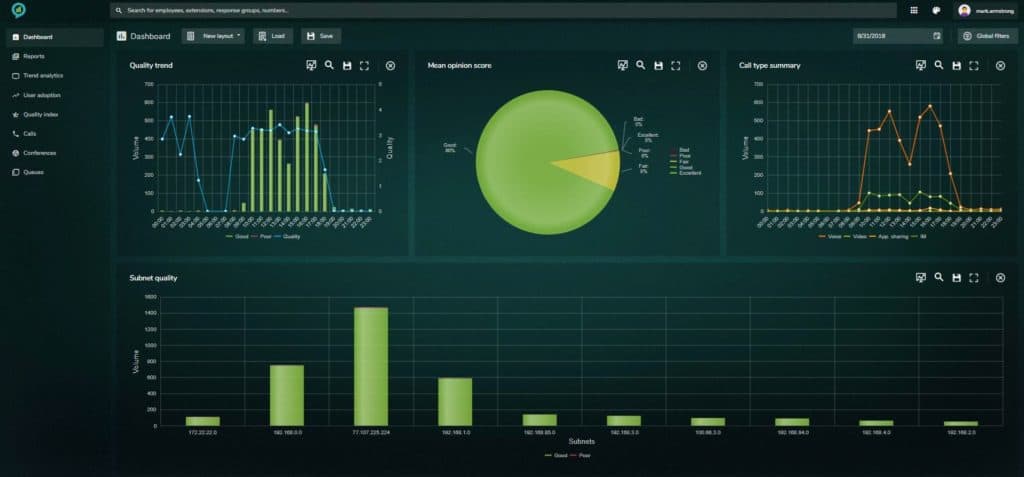
The user friendly, user driven dashboards allow Clobba users quick access to relevant information across an organisation through monitor selection and filtering. The dashboard assists in tracking employee productivity, user adoption, call quality and SIP trunk capacity. Whether a business or technical user you will have instant visibility of the required information.
ClobbaDM Inventory
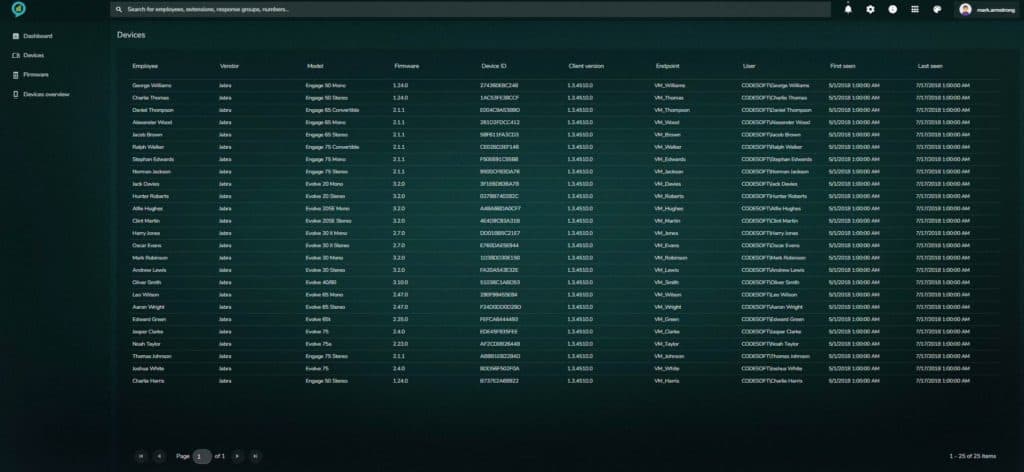
The device inventory is a comprehensive list of room and headset devices, complete with information on the assigned user, manufacturer’s make and model, firmware level and, crucially, when the device was first and last used. The headset is increasingly commonly a replacement for the desk phone and the value of the devices has increased to mirror the growing functionality and importance of these devices. Now, more than ever, it is important to track these assets and manage their utilization.
Report Assistance
One of the key strengths of Clobba is its user driven nature which is reflected in the report builder which allows for a high level of filtering when creating a report. The report assistance is a new feature which takes users through the filtering process on a step by step bases. This process means that even the more technically challenged employees will have no difficulty in creating reports which deliver only relevant information for themselves.
User Adoption
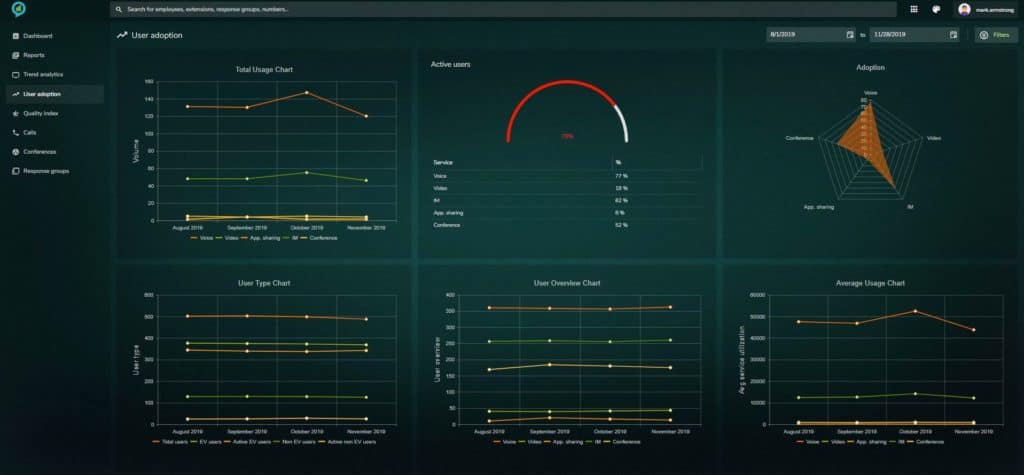
Code Software’s solutions help you to get the most from your UCC platform so that you can maximize your investment and monitor progress of users’ adoption of new technologies from the first point of deployment onward. Any organisation that is on the digital transformation journey needs to consider such a solution for their new UCC environment.
Security Policies
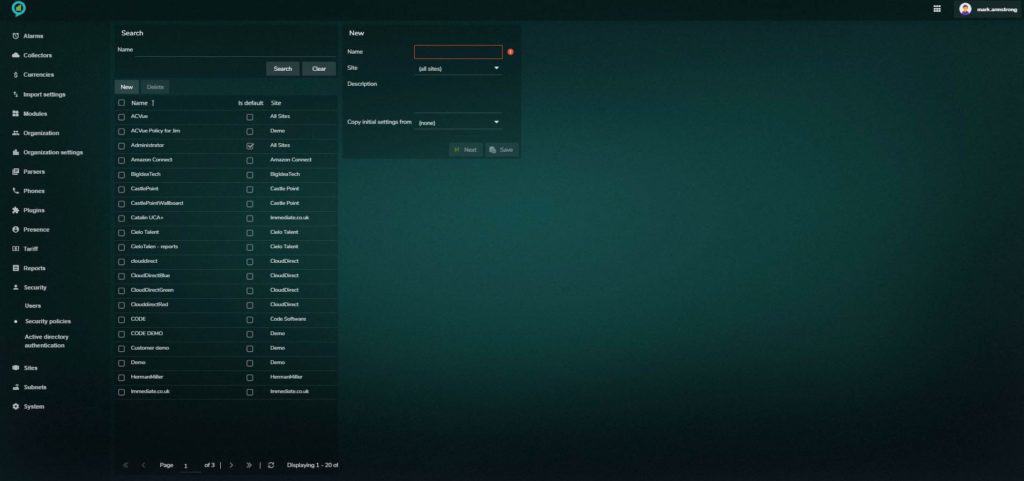
The security policies are an integral part of Clobba, they allow admins to restrict users access both at organization and feature level. Security policies are assigned when a user logs in which ensures that only allowed data is viewed, in this way Clobba can be opened up to users across the organization.
Real-time Wall Boards
The real-time wall boards in ClobbaRT show live call stats, presence details and historical call performance information. Users can select the number of monitors on the screen, the monitor type and apply filter to ensure the relevance of information displayed. The wall boards can be displayed on a wall mounted monitor giving visibility of the team and agent performance which will drive productivity gains, ensure SLA’s are being met and increase agent productivity.
Queues
The queues page in Clobba shows a graphical view of queue performance which can be filtered on a specific day and selected queues. Visibility of performance is essential to drive productivity of agents and ensure the correct allocation of resources to meet internal SLA’s which ultimately leads to an increase in customer satisfaction.
Trend Analytics
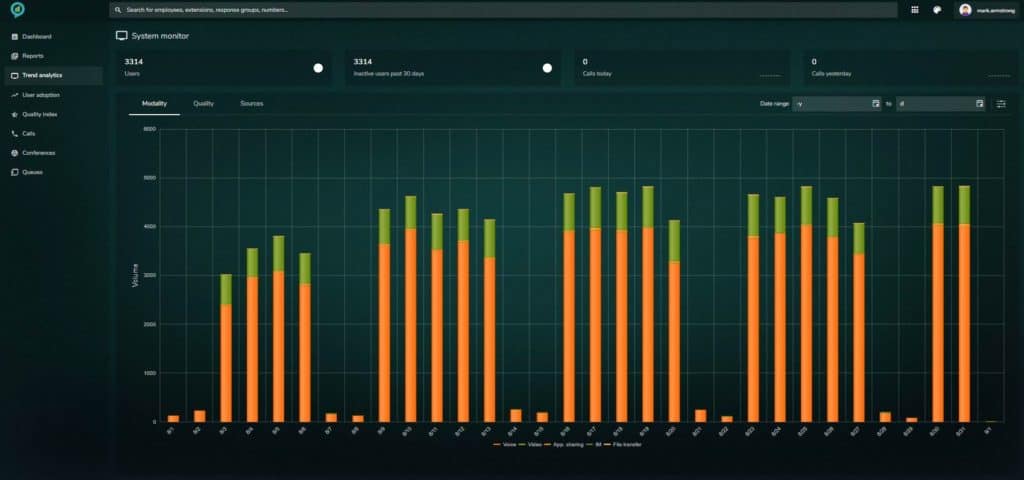
Viewing trends of adoption across an organization can allow for assured uptake and productivity gains within the modern workplace. Filtering at an organizational level and specifying the date range highlights areas for further education and training. In addition to adoption a summary view of call quality will show areas where further investigation may be required to maintain the highest levels of service delivery.
Conferences List
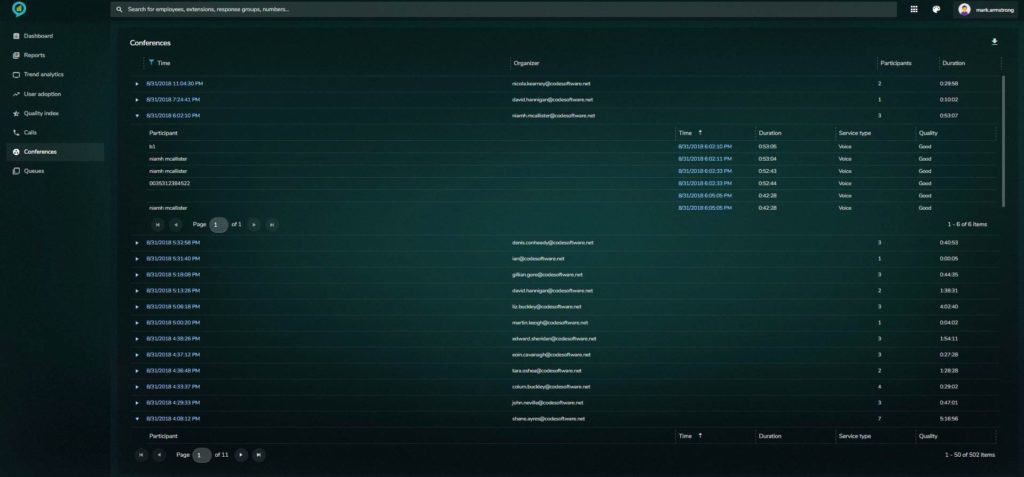
As a business, how do you gain visibility across all your conference activity? Are people frequently late to meetings or do they leave early? Who were the attendees for the call and are there patterns of behavior on regular departmental calls? Clobba gives you the insight so you can manage and improve how you operate.
User Monitor
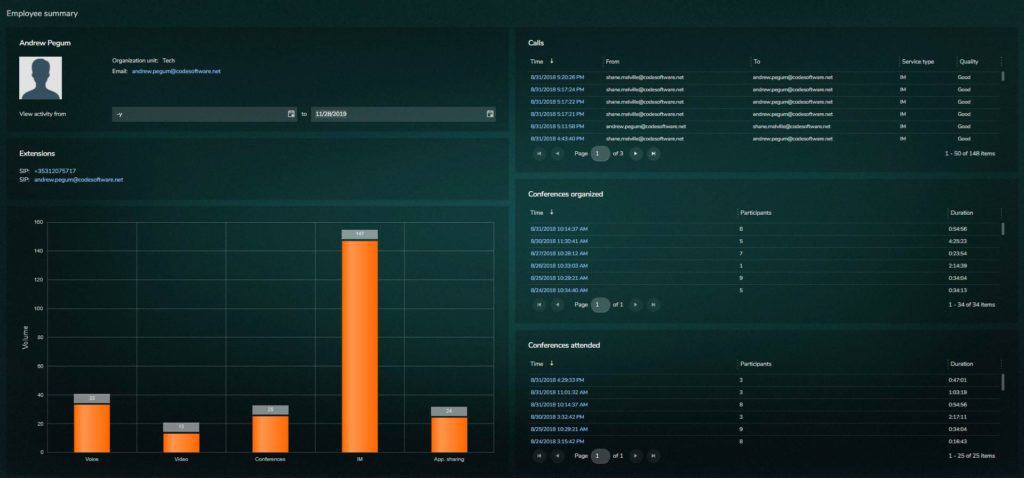
The modern workplace can be anywhere – the office, home, beach, or coffee shop – thanks to the great technology advances by companies such as Microsoft, Amazon, Cisco and Avaya. Whilst this is great for flexibility, it can pose challenges in people management and ensuring everyone is at their optimum productivity. Using Clobba’s User Monitor, individuals and their managers can keep abreast of their activity and measure it against their KPIs.
Searching
The search feature enables quick and easy access to relevant data. Users can search on individual numbers, employees, extension and response groups.
Agent Self Service
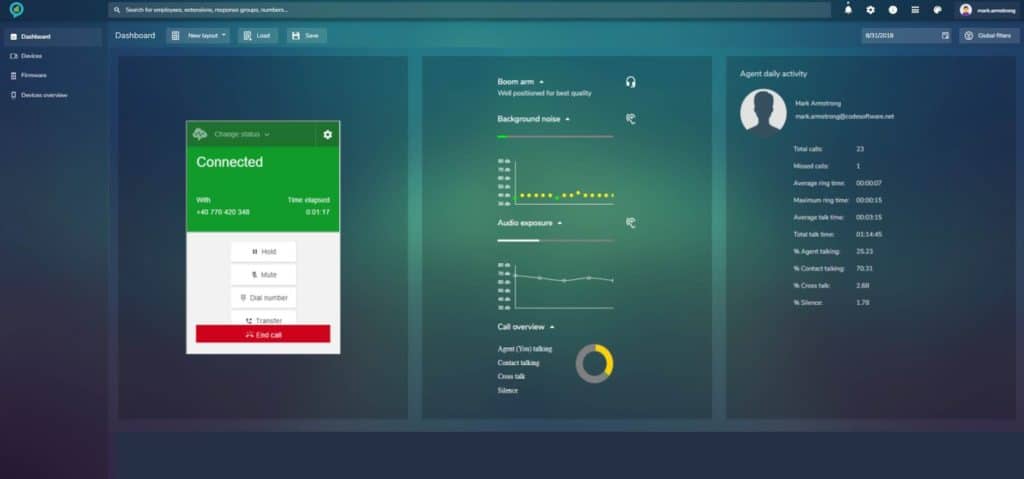
Amazon Connect customers using the Jabra Engage 50 headset can use Clobba to allow agents to self-service throughout the day. The Connect UI is displayed along with the live calls information from the Jabra headset, boom arm position, background noise, audio exposure, time of agent talking, contact talking, cross talking and silence. In addition the agents performance stats for the day are displayed. Information at the agents finger tips will drive productivity and ensure customers are receiving the highest levels of service.
Set & Go – Scheduled Reporting
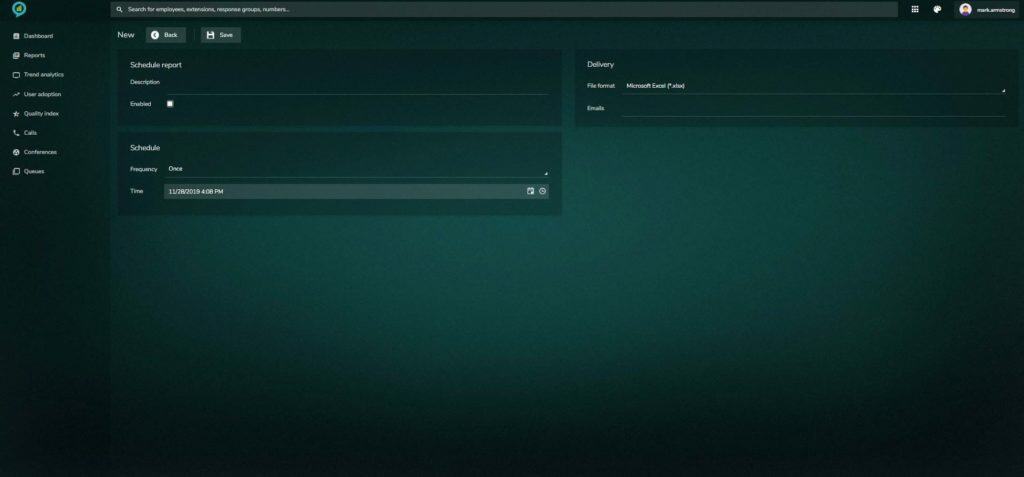
A staple of all good reporting solutions is the ability to schedule reports to be sent out on a predefined, regular basis. What differentiates Clobba from most competitors is the great flexibility that its Report Scheduler contains. Of course you can set up reports to be sent out on a daily, weekly or monthly basis, but users have the option to vary this and could schedule reports to be sent out as frequently or infrequently as they desire.
Non-approved devices and WiFi calling
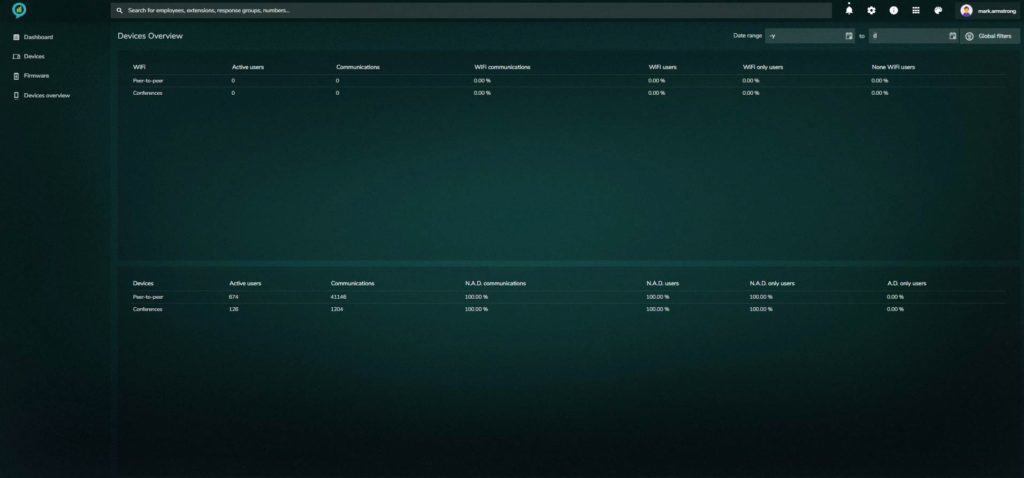
As the transition to the modern workplace continues to gather momentum management of the multiple components becomes an often too onerous task. Headsets can play a key role in the service delivery of the voice element of a UC platform and to ensure your investment Clobba has the ability to display volumes of both approved and non-approved devices across your entire estate. As much as 60% of devices used by employees are consumer or non-approved so driving the adoption of correct devices will ensure your return on investment and drive high levels of service adoption.
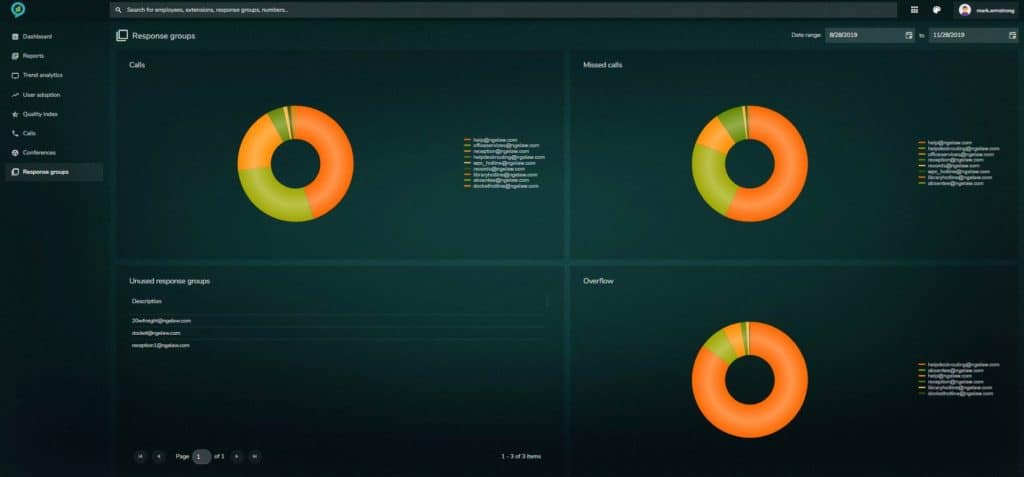
Queue Analytics
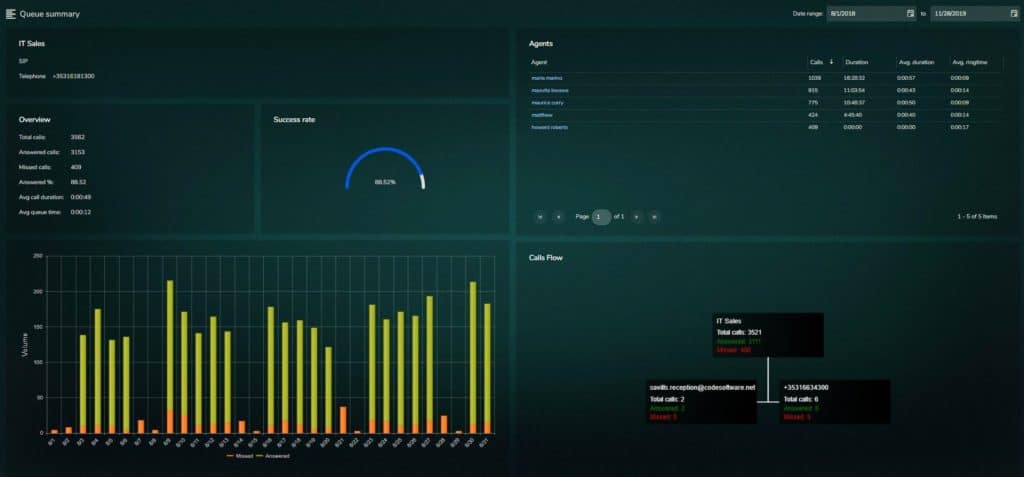
Clobba reports across a wide remit of an organisations reporting requirements. For those using the Response Groups or queue function available with Skype for Business or Amazon Connect the Queue summary page delivers summary and detailed information on the selected queue and the agents within the queue. Visibility of these stats is essential to ensure the queue call handling is at an acceptable level and that enough resources are allocated to maintain the highest levels of customer satisfaction.